Projects are a great way to track budgets and task progress. If you’re already using Projects, you’ll now see an expand arrow next to each Task or Block.
Clicking this will open the in-app Block Coverage report, which highlights the status of each row—if the task is tracked using the Assign Rows method. This gives you better visibility into how work is progressing at a detailed level.
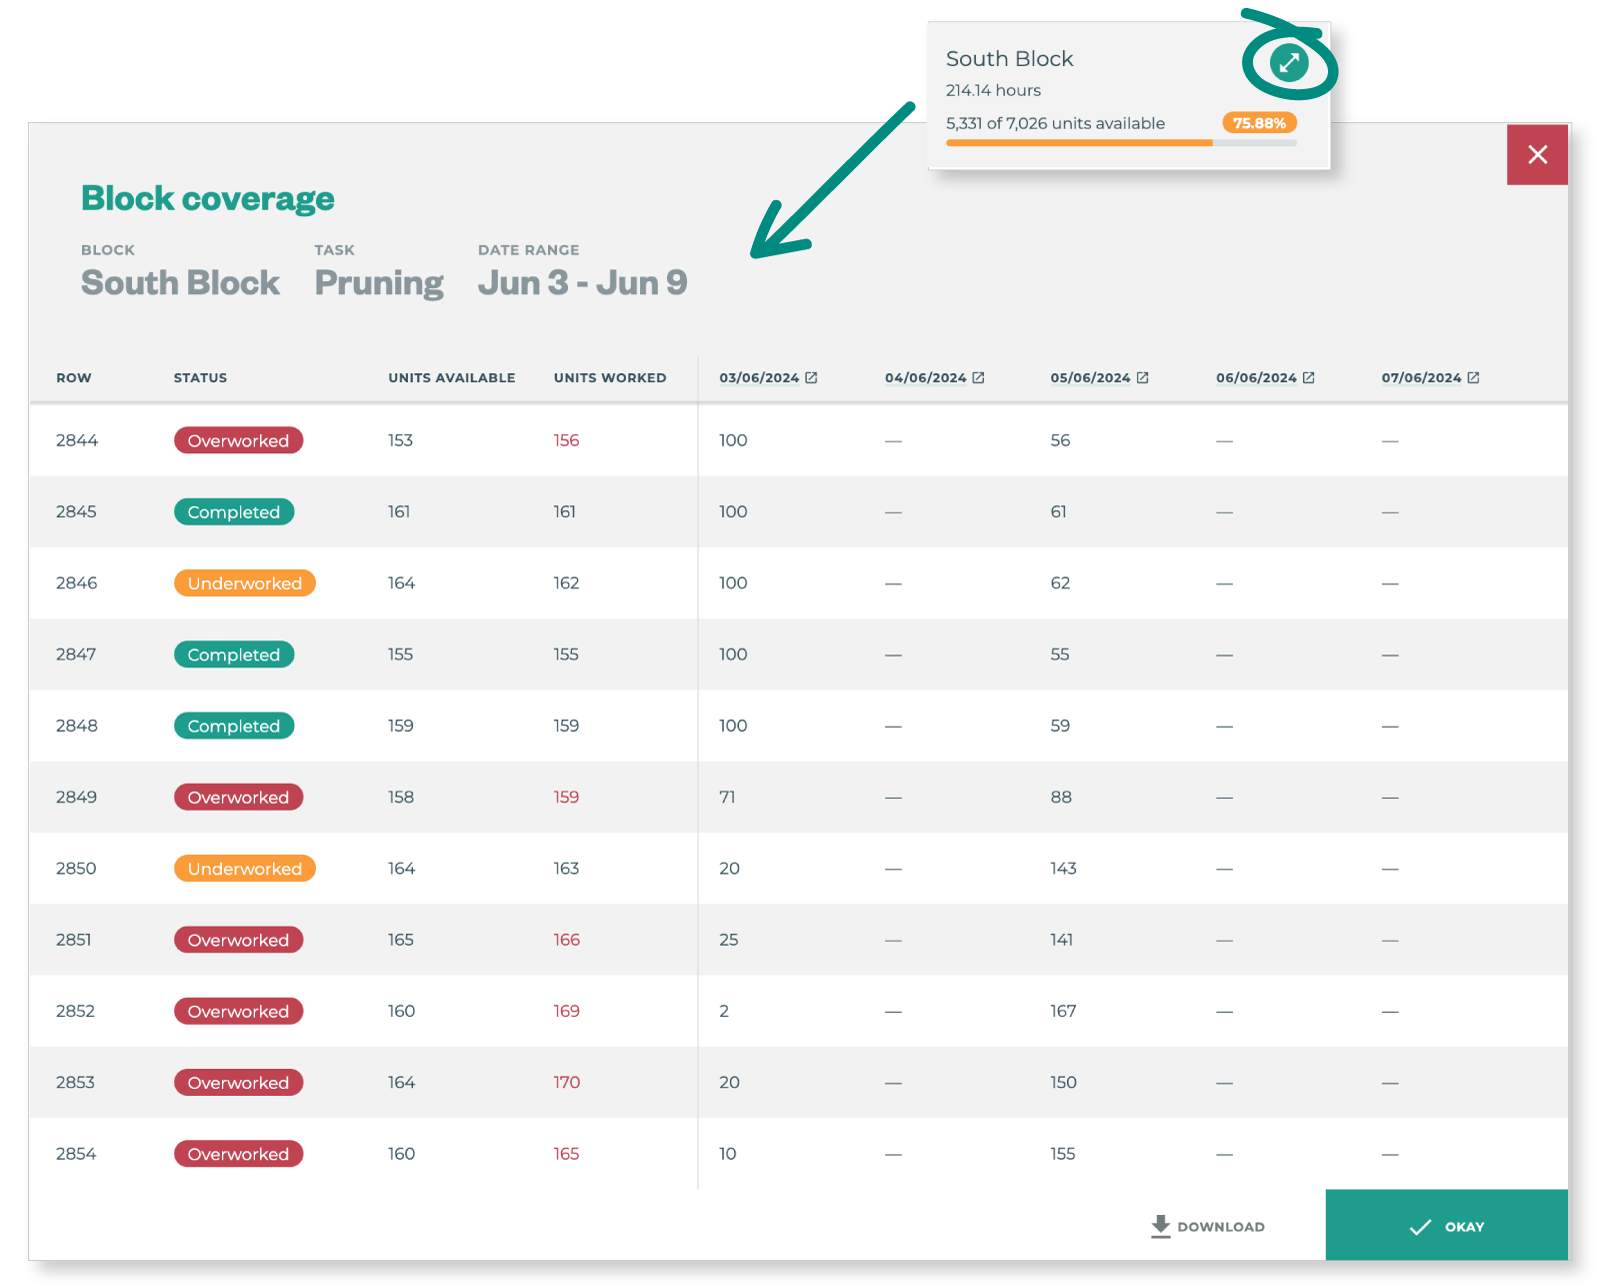
How to use the Block Coverage Report
The table shows one Task across one Block, for the a date range set in either;
-
The Task Budget date range, if none
-
The Project settings date range, if none
-
The range between the date of the first job linked and the last job linked
Row status
Your ‘traffic light’ indicators to highlight areas of concern
-
Completed = the units worked match the units available
-
UNDERWORKED = the units worked are less than the units available
-
OVERWORKED = the units worked are greater than the units available
-
NO DATA = there is no row level data available
Jobs
Related jobs are listed in columns, titled by the date and showing the units worked per row. The table allows you to see where any issues have occurred and click on the jobs in question to learn more.
Correcting or confirming OVERWORKED rows
By clicking on the date links you can open and compare the jobs side by side (in different browser tabs) to identify the supervisor and worker/s who overworked the rows. Some issues are obvious but others may require contacting the supervisor/s in question to resolve the mistake.
Correcting or confirming UNDERWORKED rows
As above opening the jobs in question to compare is the first step. In the case of underworked rows there may be missing plants that have not been updated on the Blocksheet. Checking the job notes may help understand what happened in the Field that day.
If a job date is red, this means the job is contributing to the Block Coverage Report but is not in the Project. We recommend clicking through to the job and adding the Project.