Reviewing Contract and Performance Bonus Rates
Setting contract and performance bonus rates for some tasks is easier than others. Ensuring that the rate you have set for the task matches your expectations for crew earnings and company margins/costs is important. Whether you’re starting a new task or checking crew performance, there are a couple of useful reports and dashboards within the Tātou Office App that can help users review contract and performance based work.
Assessing Crew Performance
Reviewing hourly rates for crew working on contract or performance bonus tasks is a critical component of managing crews, which is why you’ll find several reporting tools and dashboards to help keep an eye on crew performance.
Overview Dashboard → Weekly OR Daily Contract Performance Widget
With an independent date filter set to the current work week or day - this widget reports running totals of:
Total Hours
Contract Hours
Average Hourly Rate
Average Top Up Rate (per hour)
Units per Hour
This widget is set based on your Organisations Contract Top Up Calculation Period set here.

Designed to be a daily check for managers to keep an eye on employee performance as work is completed for the week.
Pro Tip: The table can be sorted by clicking on the column titles.
Sort the table by AVG. TOPUP RATE to organise employees by HIGHEST or LOWEST average top up rates.
Sort the table by AVG. HOURLY RATE to highlight any hourly rates that might be too HIGH or too LOW
Sort the table by UNITS PER HOUR to highlight any work rates that might indicate errors in data entry of units assigned.
When actively tracking contract work, this widget can be a quick reference tool for managers and supervisors to monitor crew performance that week.
Performance Dashboard → Hourly Rates Widget
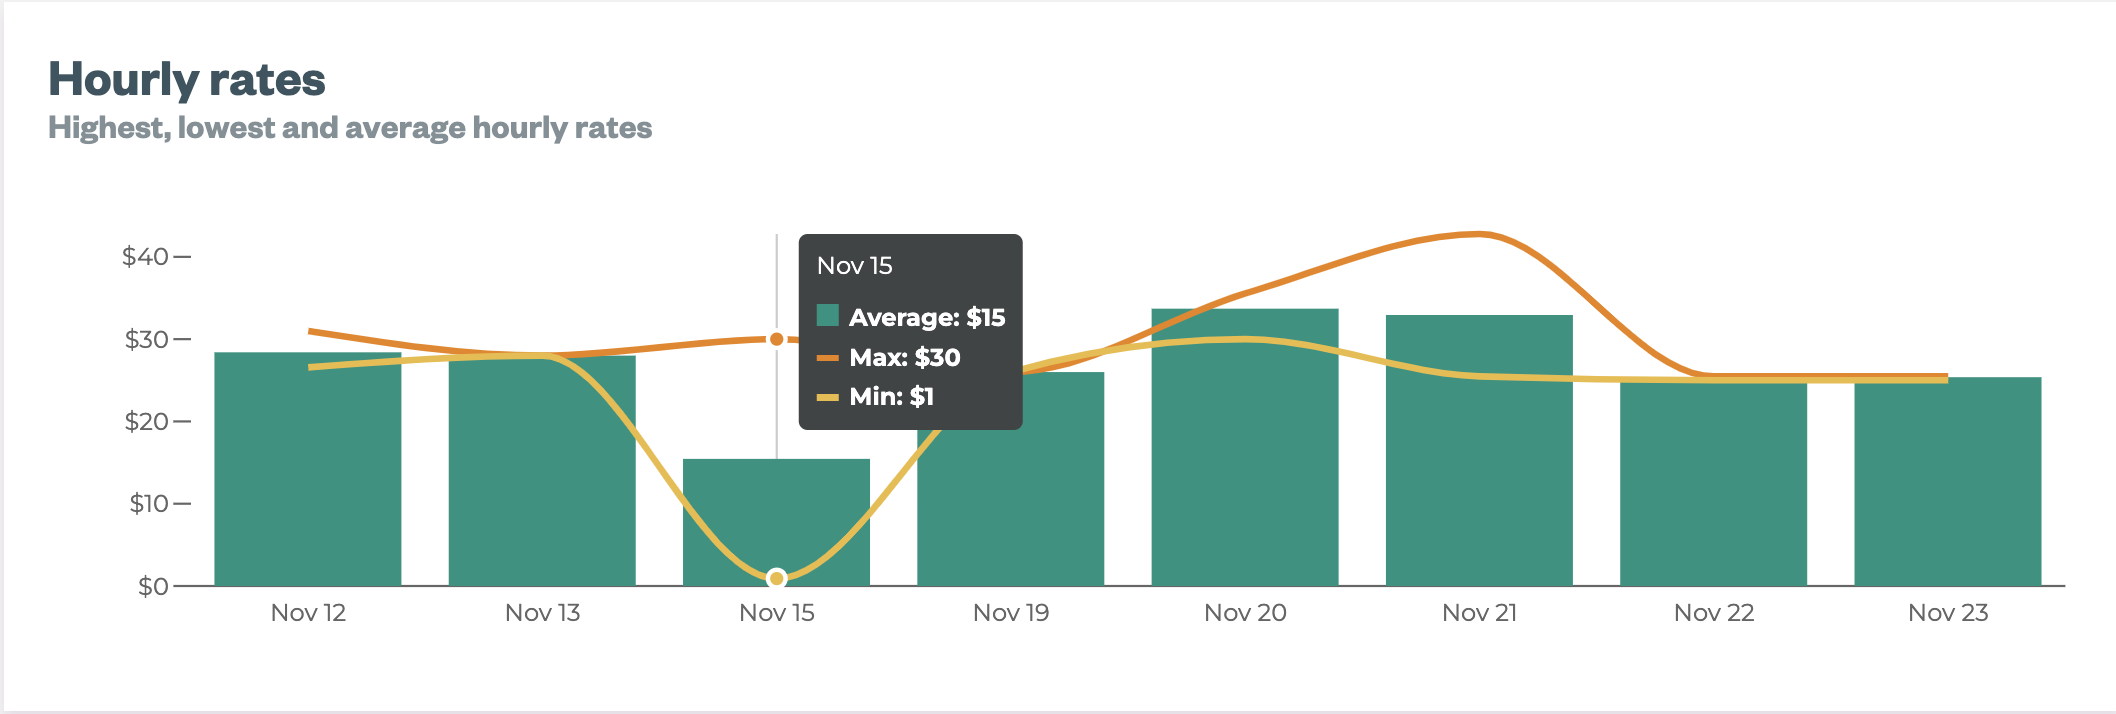
The graph in this widget shows the highest (ORANGE line), lowest (YELLOW line), and average hourly rates per day. Use this to quickly visualise hourly rates that do not make sense. Hover over the graph to see details on the daily values.

The Minimum and Average Hourly Rates reported on this Dashboard are representative of the BASE COST (units x unit rate). This is what the workers earned before any top ups.
In this example note:
MINIMUM Hourly Rate - clearly dips close to $0.00, which does not make sense → that needs to be investigated
If you have not filtered the Dashboard to Contract Rate Type - this will include hourly tracked jobs. In this example this is clear when you review Nov. 22 and Nov. 23 - as the Min, Max, and Average Hourly Rates are all the same.
If reviewing with all rate types selected, the Minimum and Maximum hourly rate lines will still be informative, but the Average Hourly Rate bars may not be as useful because the value is lessened by averaging across all hours.
Where Daily Top Up Calculation Periods are used - it is important to filter to Contract Rate Type only, so that in the event that crews completed hourly work and Contract work, the min, max and averages highlight potential issues with partial day contract work.
Reports
The Rates Report is a quick way to review critical information relating to Jobs tracked on contract and performance bonus (as well as hourly jobs) with the following columns summarised for each job.
Rate Type | Unit Rate $ | Sales value $ | Total cost | Margin % | Avg hourly rate $ | Total hours | Total units |
Each Job represents 1 line of the report - crews have submitted more than 1 Job for a task, or they worked on multiple tasks per day, these values may not give the full picture required to assess rates fully.
